The first one is visualization of collocations and the second is n-gram search with a gap. I will explain what these mean.
The visualization of collocations is an idea proposed by Prof. Tabata at Osaka University, Japan. This is simply a realization of his idea (not mine). Now, let me show you the current implementation.
To use this function, you need a word list and collocation with the same corpus. So run Word Count and Collocation. The Visual (name is tentative) button is on the Collocation tool. Click it to display the Visualizer panel.

The settings of the Visualizer as follows:

The top one is which statistics to use for visualization. The choices are shown below.

Then select the span/position of collocated words. The upper choice is a position from L5 to R5. If you select R1, only the information on the R1 position (frequency) is used to calculate a selected statistic. If you enable Span, the calculation will be based on the tally of frequency up to the selected position. For example, if you select R3 and check Span, the information in R1, R2, and R3 positions will be used to calculate statistics. The lower choice is a span to the left and right of the keyword. You can select from L1~R1 to L5~R5.

Take xxx words means the first xxx words on the Collocation table will be used for visualization. So if you sort the results on the Collocation table, the words taken from the list will be affected.
Now let's see what this does.

With this setting, the result will look like this. Larger the number, bigger the font size.

This simply reflect the frequency of words in the L1 position. Our (80) is the most frequent and American (40) follows. But the picture is quite different with MI (Mutual information).

You can also incorporate frequency information with other statistic result. If you enable Include Freq Info, the frequency information will be added with a gray scale.

The result will look like this:

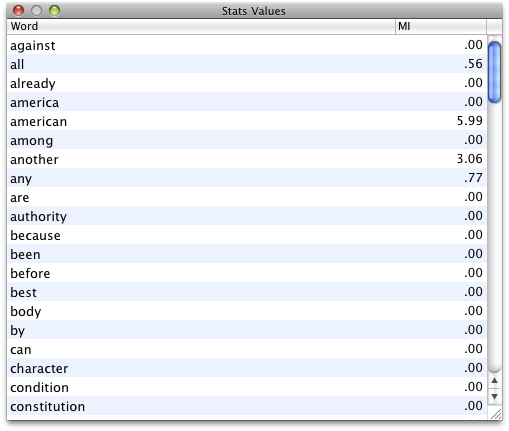
If you click Stats button, you can see the actual numbers on a table. You can sort by alphabetical order of words or stats values.
If you check Ignore zero occurrence, words with zero frequency will be removed from the display.


If you choose Log-Likelihood, because of its values, higher values can go extreme, so you can convert LL value with log(10). To enable this, click Convert LL val to log.

With the original LL values, the image will look like this:

With the conversion, it will look like this:

The choice is up to you.
The most experimental part is visualization with 4 statistics. By clicking Use Multiple info, you can incorporate three additional statistics values.

When the above three statistics are applied with MI as the primary statistic, the image will look something like this:

Blueish or Greenish font colors mean relative values of z-score and Log-log are low compared to a relative value of Log-Likelihood. But the actual values of each statistic can vary a lot, the displayed color scheme may not reflect a true relationships among statistics. I need to figure out the way to visualize the optimum relationships among statistics values. If you have any suggestion, I'd most appreciate it.
Finally, the statistic values of all four indicators can be checked on the stats value table.

You can sort the items by clicking the header of columns.

That's about it. As I mentioned at the beginning, this feature is not available on the current beta. If you'd like to try this, please contact me directly. My email address is on the CauslConc sites (the links are on the right side column of this blog).
No comments:
Post a Comment